SCRuB QIIME2 Plugin Tutorial
![]()
Getting ready
In this tutorial we use SCRuB to decontaminate a dataset comparing the plasma samples of cancer and control subejcts published in Poore et al. This data can be downloaded with the following links:
Note: This tutorial assumes you have installed QIIME2 using one of the procedures in the install documents. This tutorial also assumes you have installed SCRuB.
First, we make a tutorial directory and download the data specified above to the plasma-data directory:
mkdir SCRuB-example
mkdir SCRuB-example/plasma-data
mkdir SCRuB-example/results
cd SCRuB-example/plasma-data
wget https://github.com/Shenhav-and-Korem-labs/q2-SCRuB/raw/main/ipynb/plasma-data/table.qza
wget https://github.com/Shenhav-and-Korem-labs/q2-SCRuB/raw/main/ipynb/plasma-data/metadata.tsv
cd ..
Decontaminating
To run SCRuB we only need a single command, whose inputs and parameters are described here. In this tutorial our control_idx_column parameter is is_control, our sample_type_column is sample_type, and our well_location_column is well_id. Now we are ready to SCRuB away the contamination. This can be accomplished through three interfaces, which we provide below:
Command line
qiime SCRuB SCRuB --i-table plasma-data/table.qza --m-metadata-file plasma-data/metadata.tsv --p-control-idx-column is_control --p-sample-type-column sample_type --p-well-location-column well_id --p-control-order "control blank DNA extraction,control blank library prep" --o-scrubbed results/scrubbed.qzaNext we load all samples to produce a few visualizations:
import os
import warnings
import qiime2 as q2
# hide pandas Future/Deprecation Warning(s) for tutorial
warnings.filterwarnings("ignore", category=DeprecationWarning)
warnings.simplefilter(action='ignore', category=FutureWarning)

# import table
table = q2.Artifact.load('plasma-data/table.qza')\
# import metadata
metadata = q2.Metadata.load('plasma-data/metadata.tsv')
# import SCRuB output
scrubbed = q2.Artifact.load('results/scrubbed.qza')
QIIME2
First we will import our data with the QIIME2 Python API
import os
import warnings
import qiime2 as q2
from qiime2.plugins.SCRuB.methods import SCRuB
# hide pandas Future/Deprecation Warning(s) for tutorial
warnings.filterwarnings("ignore", category=DeprecationWarning)
warnings.simplefilter(action='ignore', category=FutureWarning)

# import table
table = q2.Artifact.load('plasma-data/table.qza')
# import metadata
metadata = q2.Metadata.load('plasma-data/metadata.tsv')
Next, we will run SCRuB on this dataset:
scrubbed = SCRuB(table,
                 metadata,
                'is_control', #specifies metadata column where True denotes the negative controls
                'sample_type', #specifies metadata column denoting the sample type
                'well_id', #specifies metadata column representing samples location in 'A11','B10' format
                'control blank DNA extraction,control blank library prep' # order of decontamination
                )
Python
import os
import warnings
import pandas as pd
import numpy as np
from q2_SCRuB import SCRuB
# hide pandas Future/Deprecation Warning(s) for tutorial
warnings.filterwarnings("ignore", category=DeprecationWarning)
warnings.simplefilter(action='ignore', category=FutureWarning)

# import table
table =pd.read_csv('plasma-data/table.tsv', sep='\t', index_col=0)
# import metadata
metadata = pd.read_csv('plasma-data/metadata.tsv', sep='\t', index_col=0)
Now, we can run SCRuB:
scrubbed = SCRuB(table,
                 metadata,
                'is_control', #specifies metadata column where True denotes the negative controls
                'sample_type', #specifies metadata column denoting the sample type
                'well_id', #specifies metadata column representing samples location in 'A11','B10' format
                ['control blank DNA extraction','control blank library prep']
                )
Assessing output
Now we can compare the raw table and SCRuB’s output:
from qiime2.plugins.gemelli.actions import rpca
from qiime2.plugins.emperor.actions import (plot, biplot)
# run RPCA and plot with emperor
rpca_biplot, rpca_distance = rpca(table)
rpca_biplot_emperor = biplot(rpca_biplot, metadata)
# make directory to store results
output_path = 'results'
if os.path.isdir(output_path)==False:
os.mkdir(output_path)
# now we can save the plots
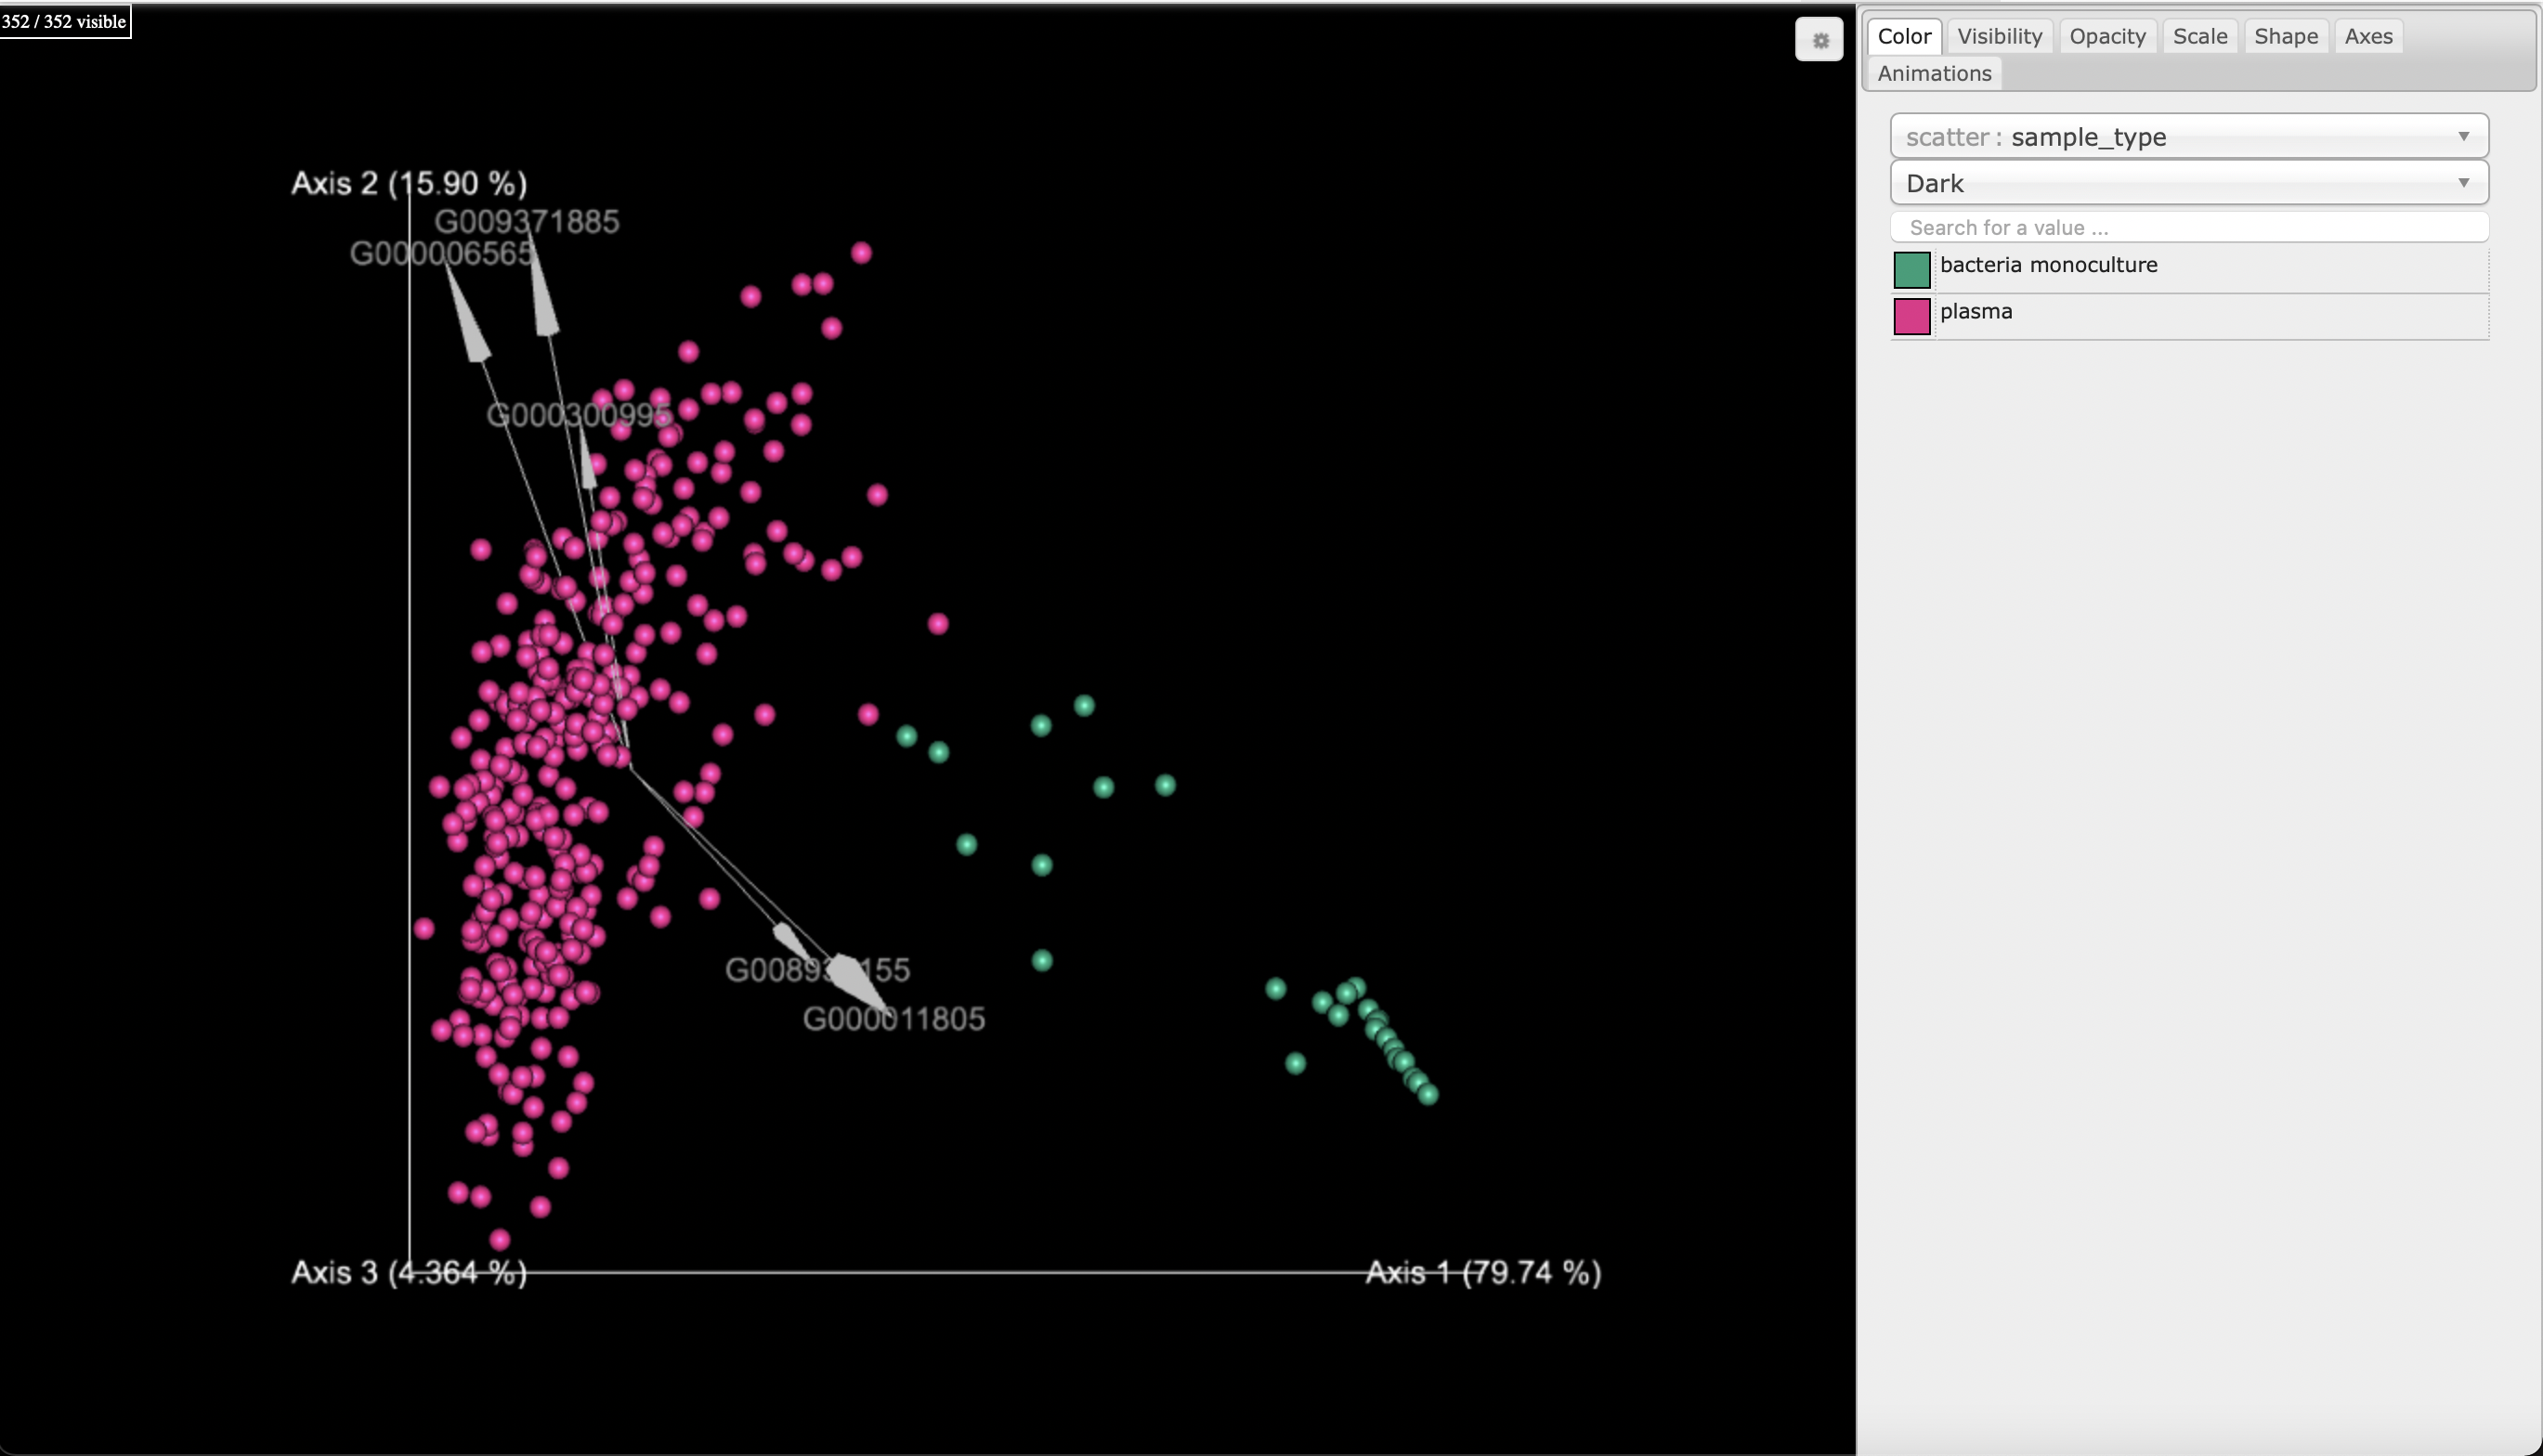
rpca_biplot_emperor.visualization.save(os.path.join(output_path, 'Raw-RPCA-biplot.qzv'))Now we can visualize the samples via RPCA

For comparison, we can observe the samples decontaminated by SCRuB. Note that the decontamination increased the observed separation between the plasma samples and the bacterial monocultures:
# run RPCA and plot with emperor
rpca_biplot, rpca_distance = rpca(scrubbed)
rpca_biplot_emperor = biplot(rpca_biplot, metadata)

# save the plots
rpca_biplot_emperor.visualization.save(os.path.join(output_path, 'SCRuBbed-RPCA-biplot.qzv'))